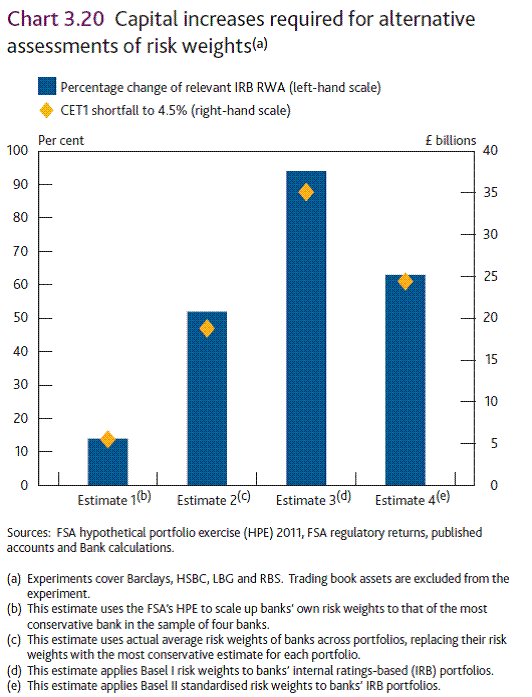
The Bank of England recently published its bi-annual financial stability report for November 2012. As usual it contains some very interesting stuff. Let me highlight a few things. The first thing I want to highlight is the graph below on bank capital requirements. It shows an interesting comparison, namely what the shortfall in bank capital looks like when capital is calculated in different ways. It shows that the risk weights that result from banks’ internal rating-based models are significantly lower compared to those resulting from alternative measures for required capital. According to the BoE this could indicate that capital levels in the UK are currently overstated. Regulators in other EU countries should follow this lead (and publish their results).
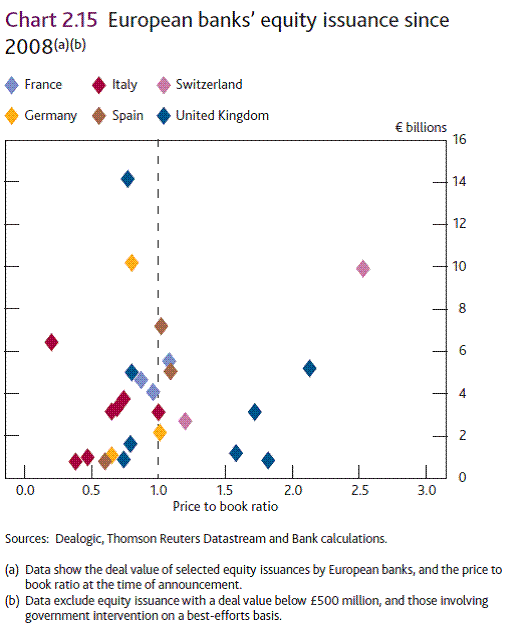
The second thing I want to highlight is the BoE view on equity issuance. I quote ‘Since the early stages of the financial crisis, large amounts of equity have been issued by banks. (…) This suggests low bank valuations are not of themselves an obstacle to issuing equity.’ The graph below substantiates this view. It contrasts with the line I’ve heard from other central banks, who regularly argue that banks can only recapitalize by withholding dividend or shedding assets. Of course, banks do not like issuing equity and would rather spare their stockholders. But from a social perspective issuing capital is the preferred way of recapitalizing.
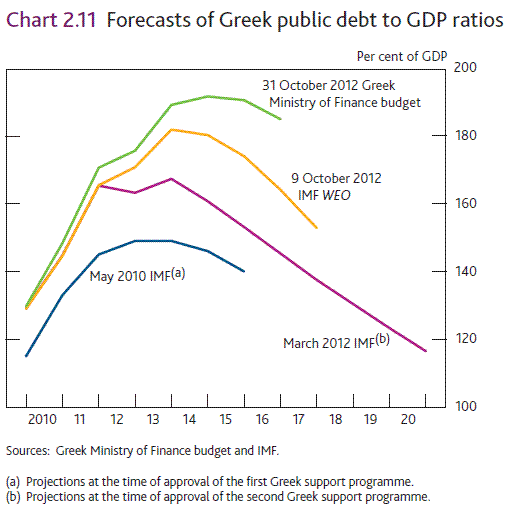
The third thing I want to highlight is the graph below on Greece. It shows the projection of development of Greek GDP at different stages in the eurocrisis. Note that these projections are consistently over-optimistic. Based on this graph, you may guess what the answer will be to the question: ‘Will we need further debt reductions for Greece?’.


